Lab 2 Overview
The purpose of this lab is to add the IMU to our robot, start running the Artemis+sensors from a battery, and record a stunt on our RC robot.
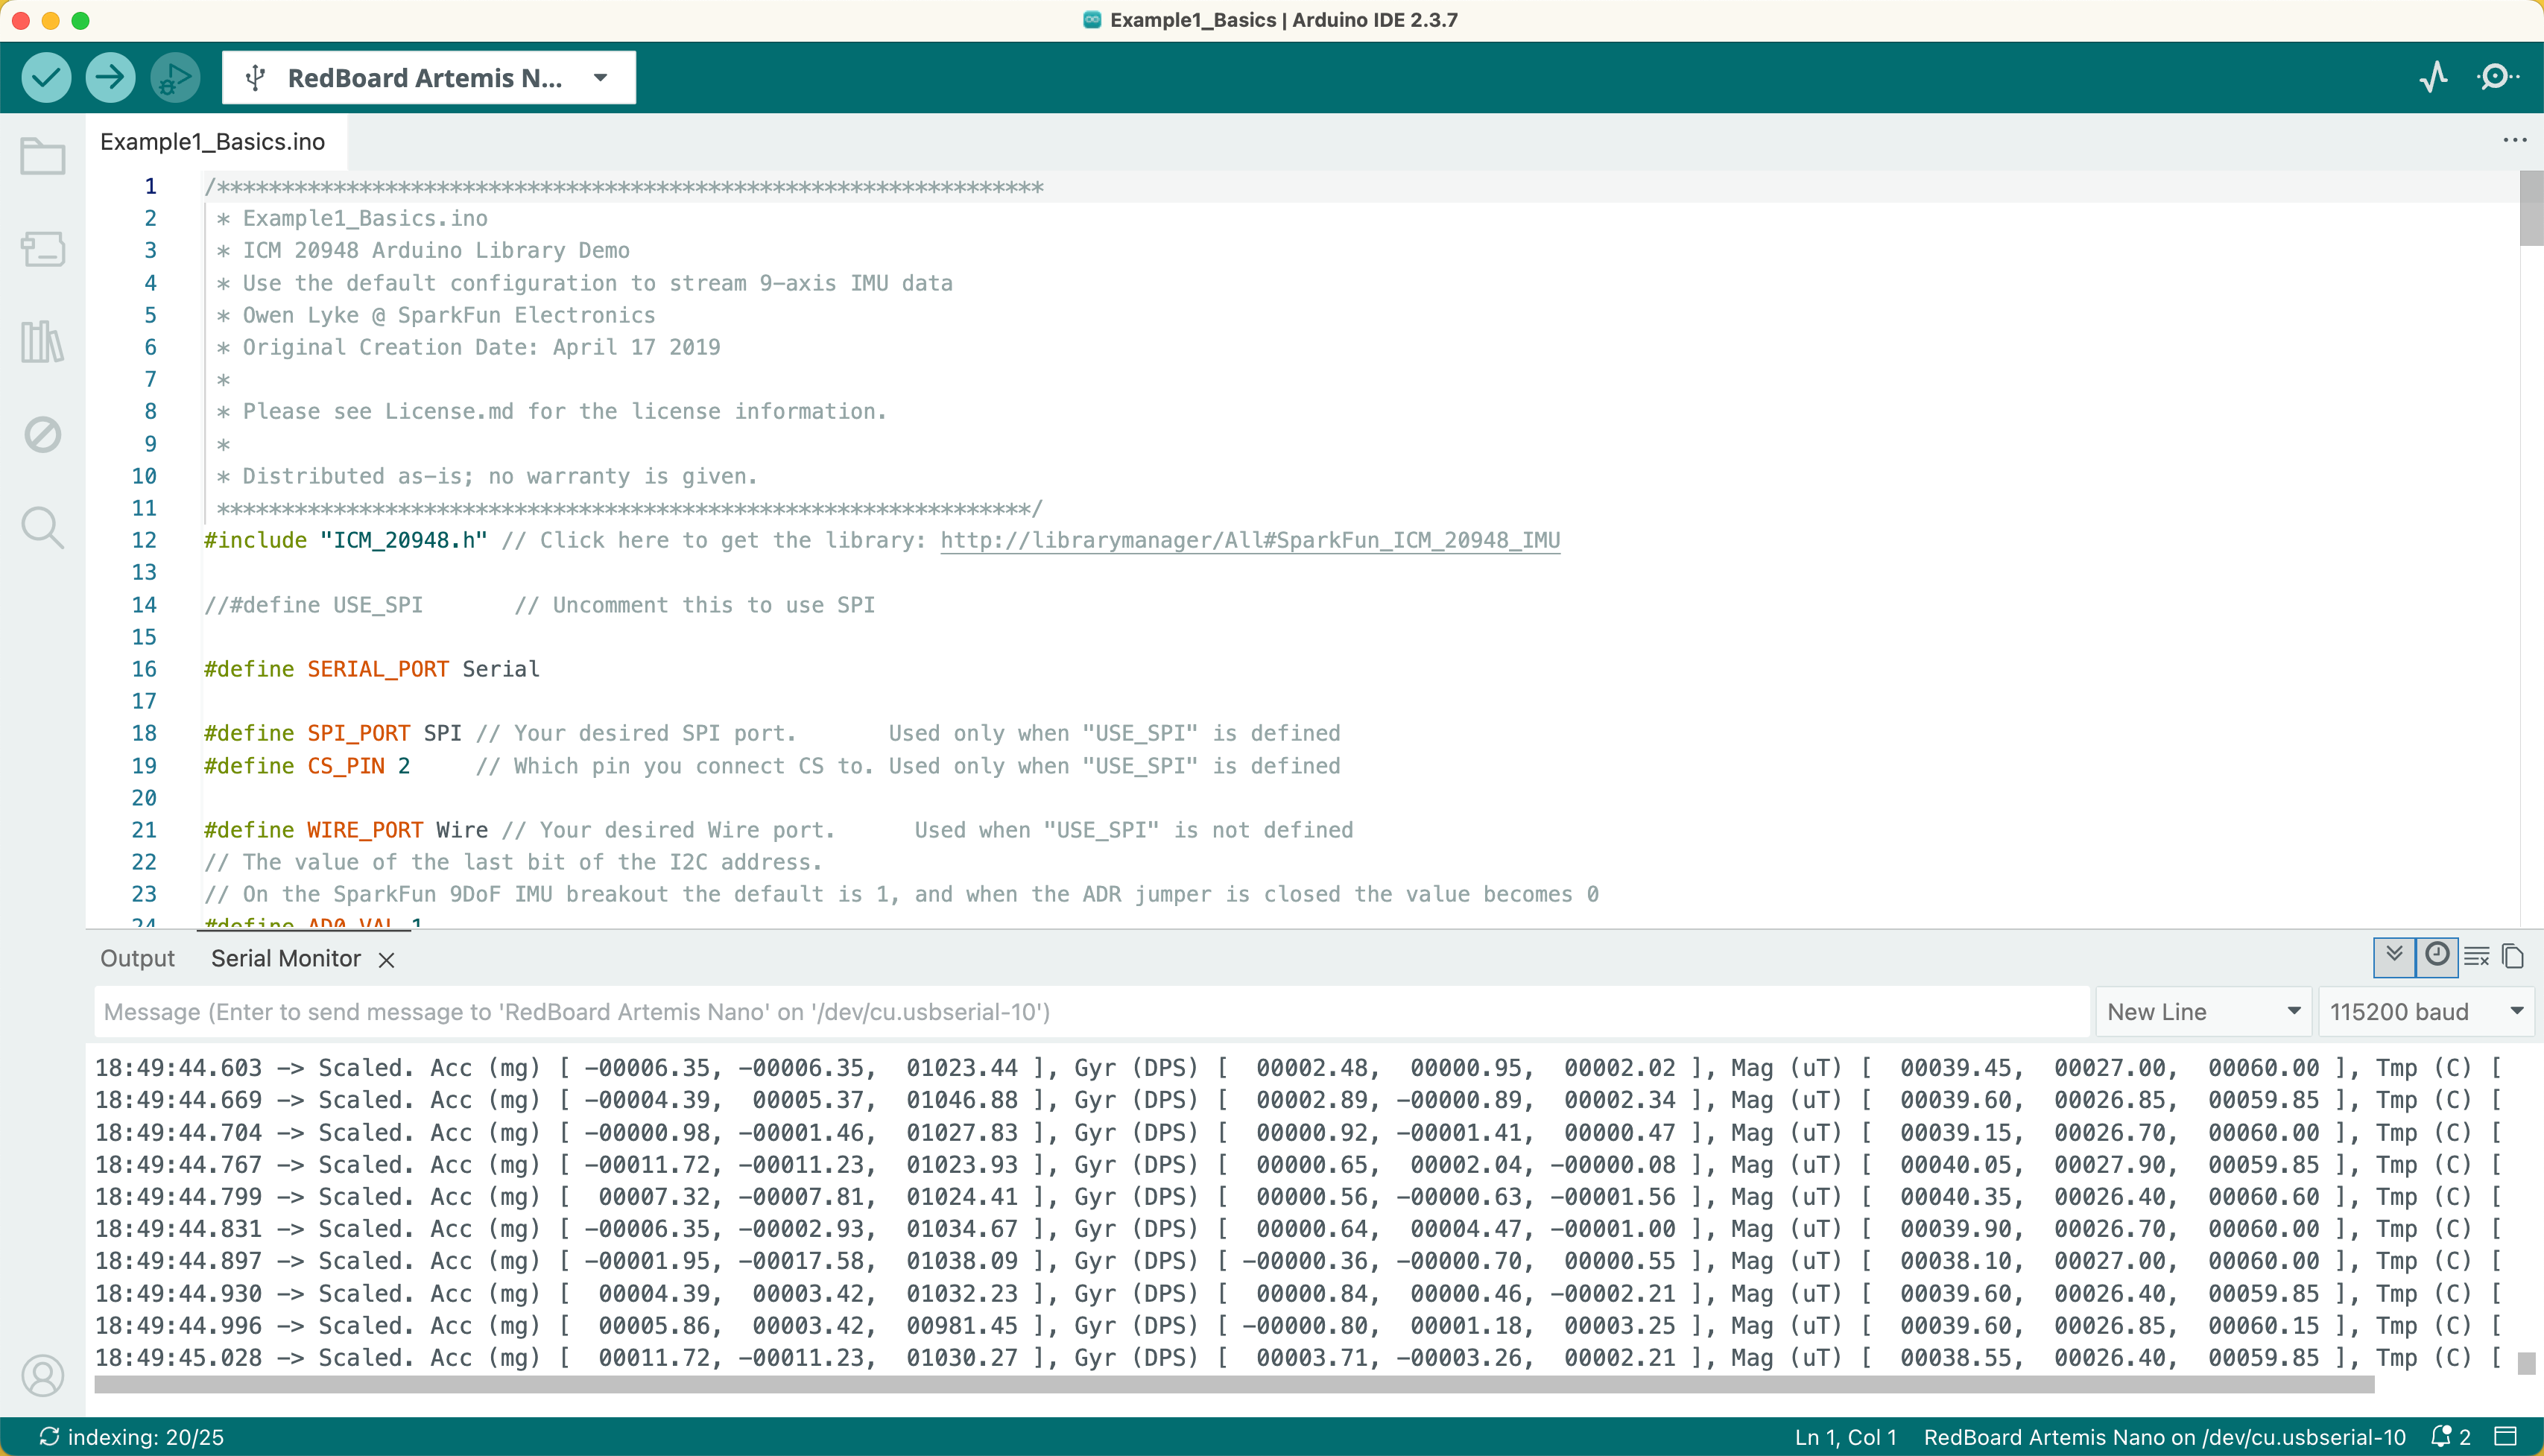
IMU Setup
To configure the IMU, the AD0_VAL was set to 1. This matches the hardware configuration where the unsoldered ADR jumper pulls the AD0 pin to a HIGH state, determining the least significant bit of the I2C address.
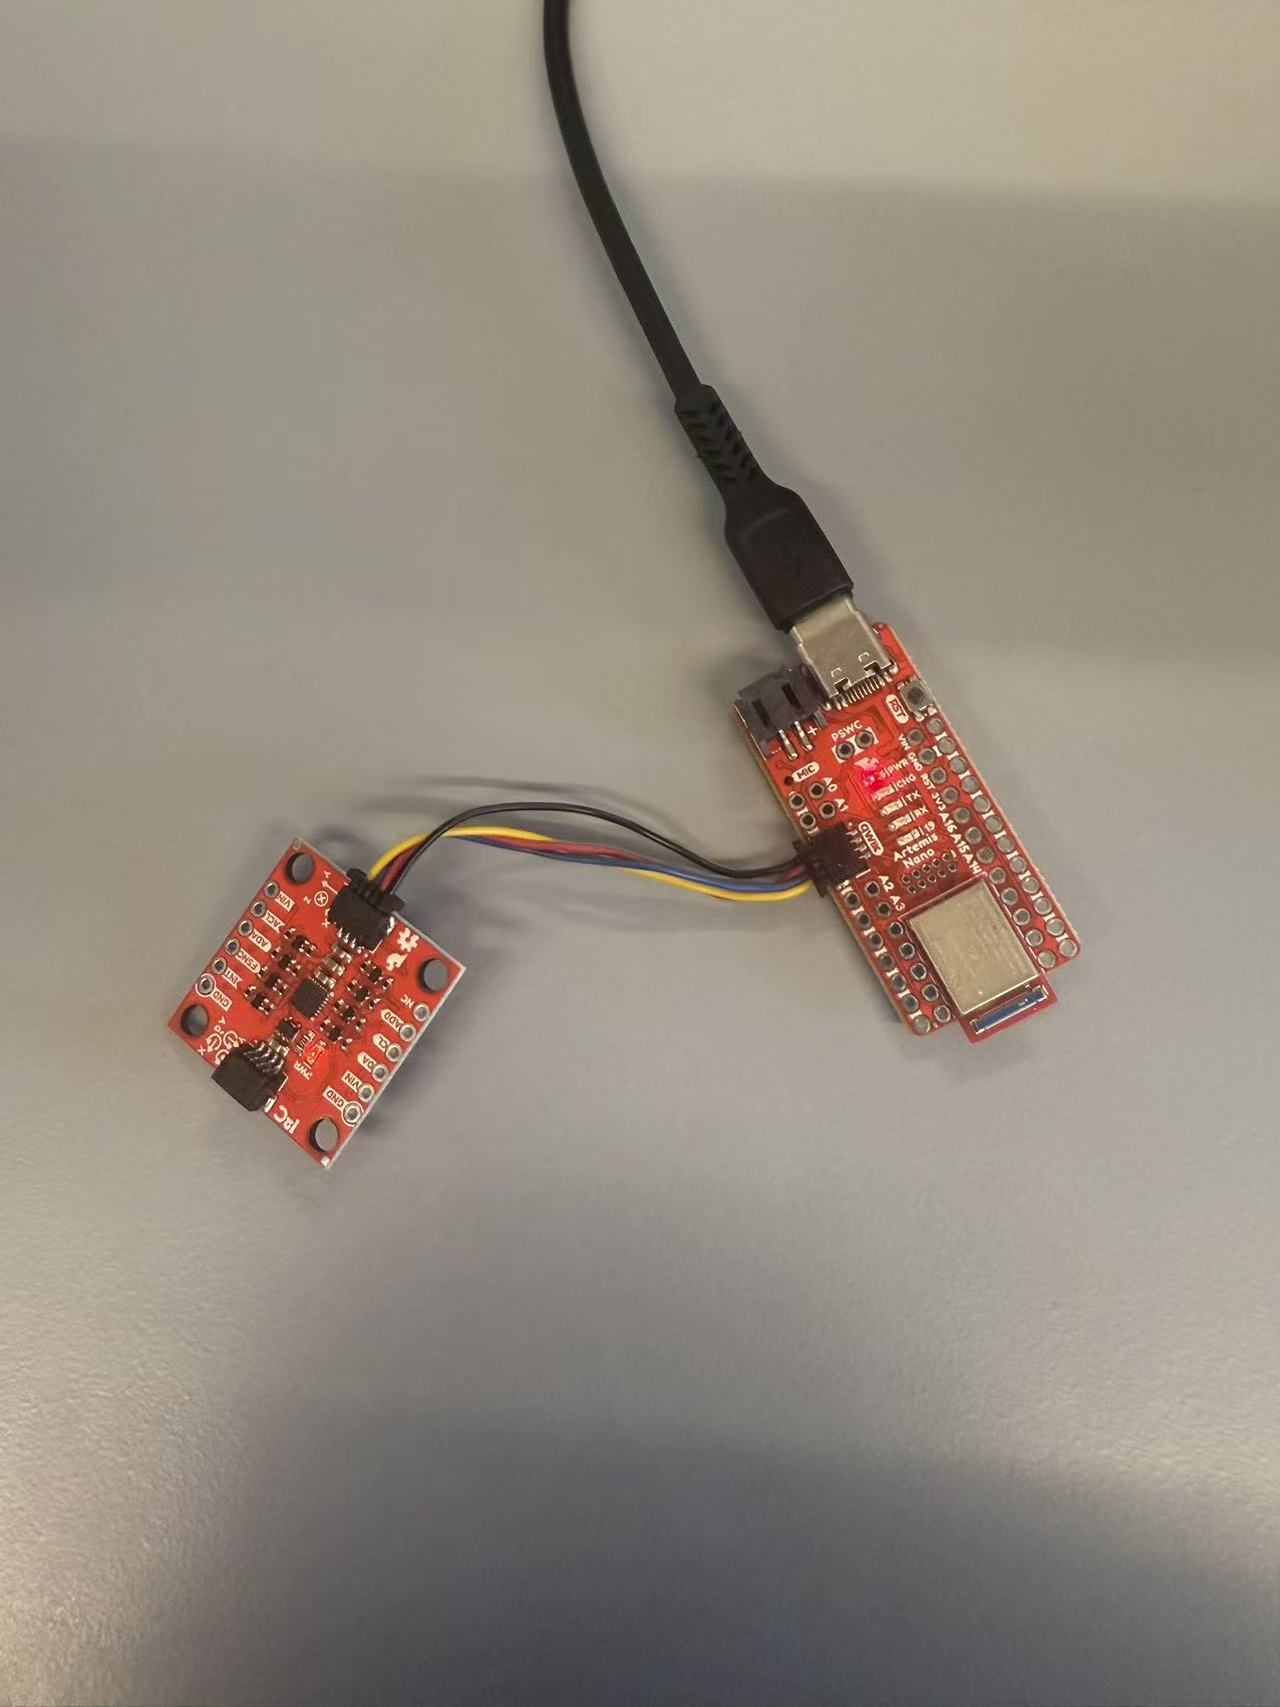
To verify the setup, the Example1_Basics library script was executed. Successful acquisition of accelerometer and gyroscope data confirmed that the IMU was fully operational and communicating correctly.
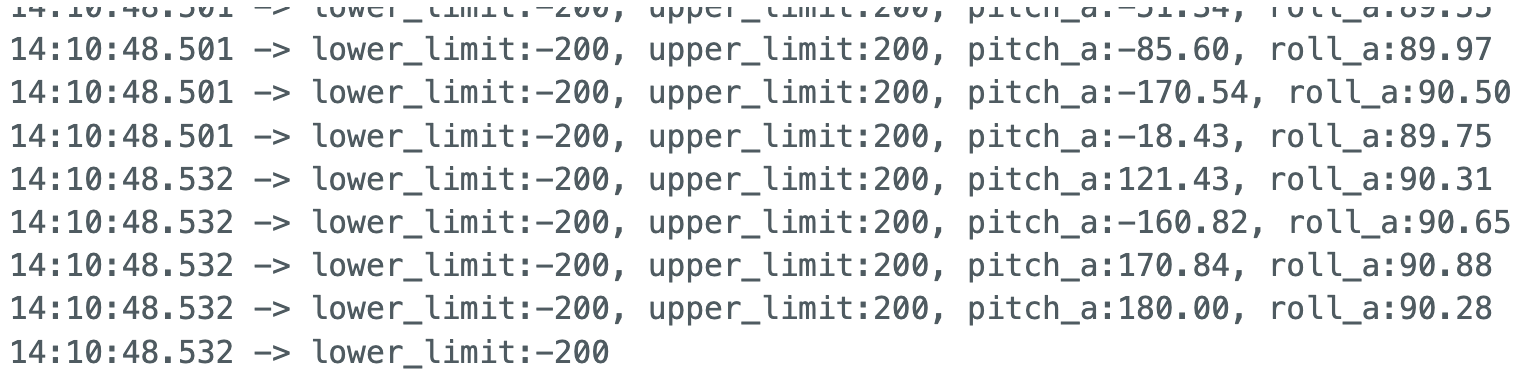
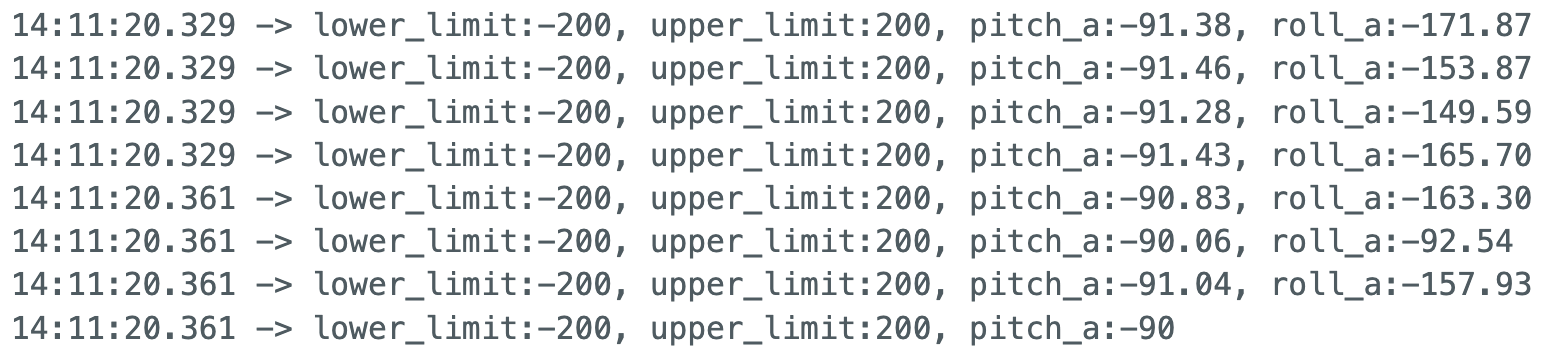
Accelerometer
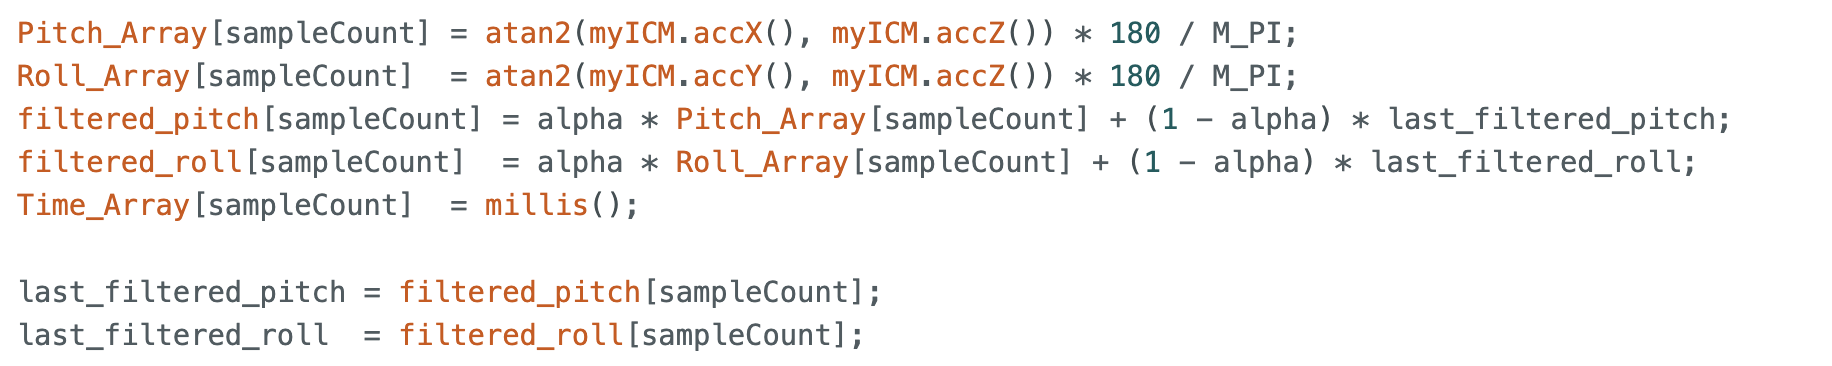
According to the content in the Lecture4-IMU file, I used atan2 and M_PI to convert the accelerometer data into pitch and roll. Based on the pitch and roll results obtained during the experiment, I found that the measurement accuracy was sufficiently high with minimal error. Therefore, I did not proceed with the subsequent two-point calibration.

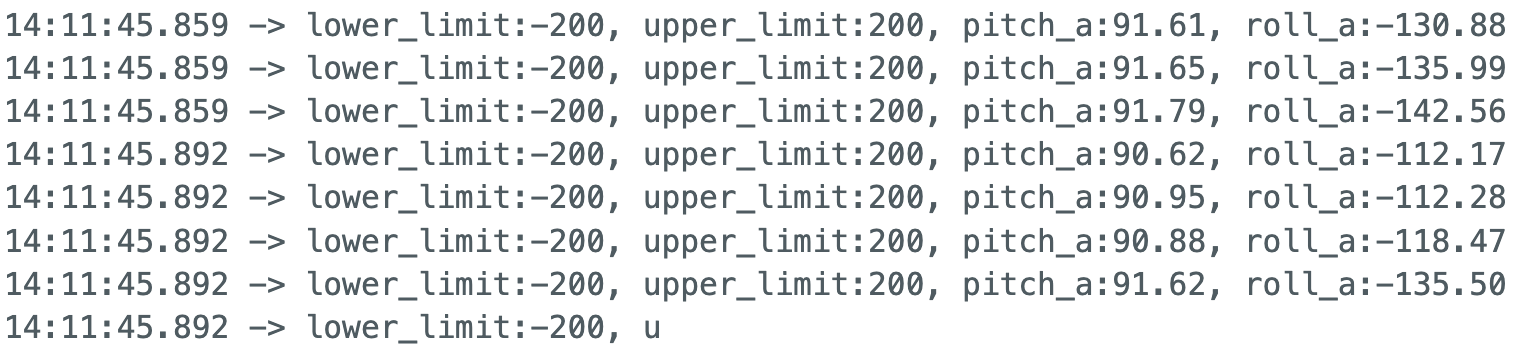
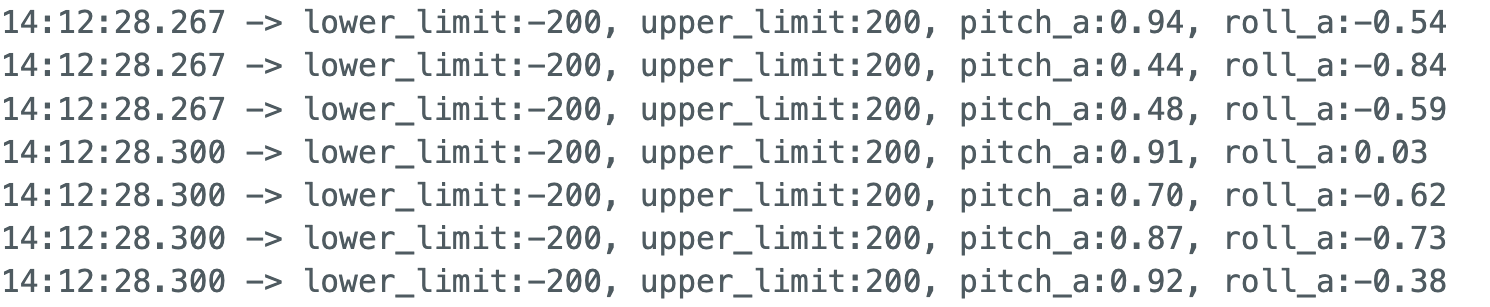
Following preliminary testing, I implemented a Bluetooth data collection system using a buffering strategy similar to Lab 1. Data was first aggregated within a continuous loop on the board and then transmitted to a Python list. This approach facilitated the plotting of rotation angles against time, allowing for observation and analysis of the sensor data.
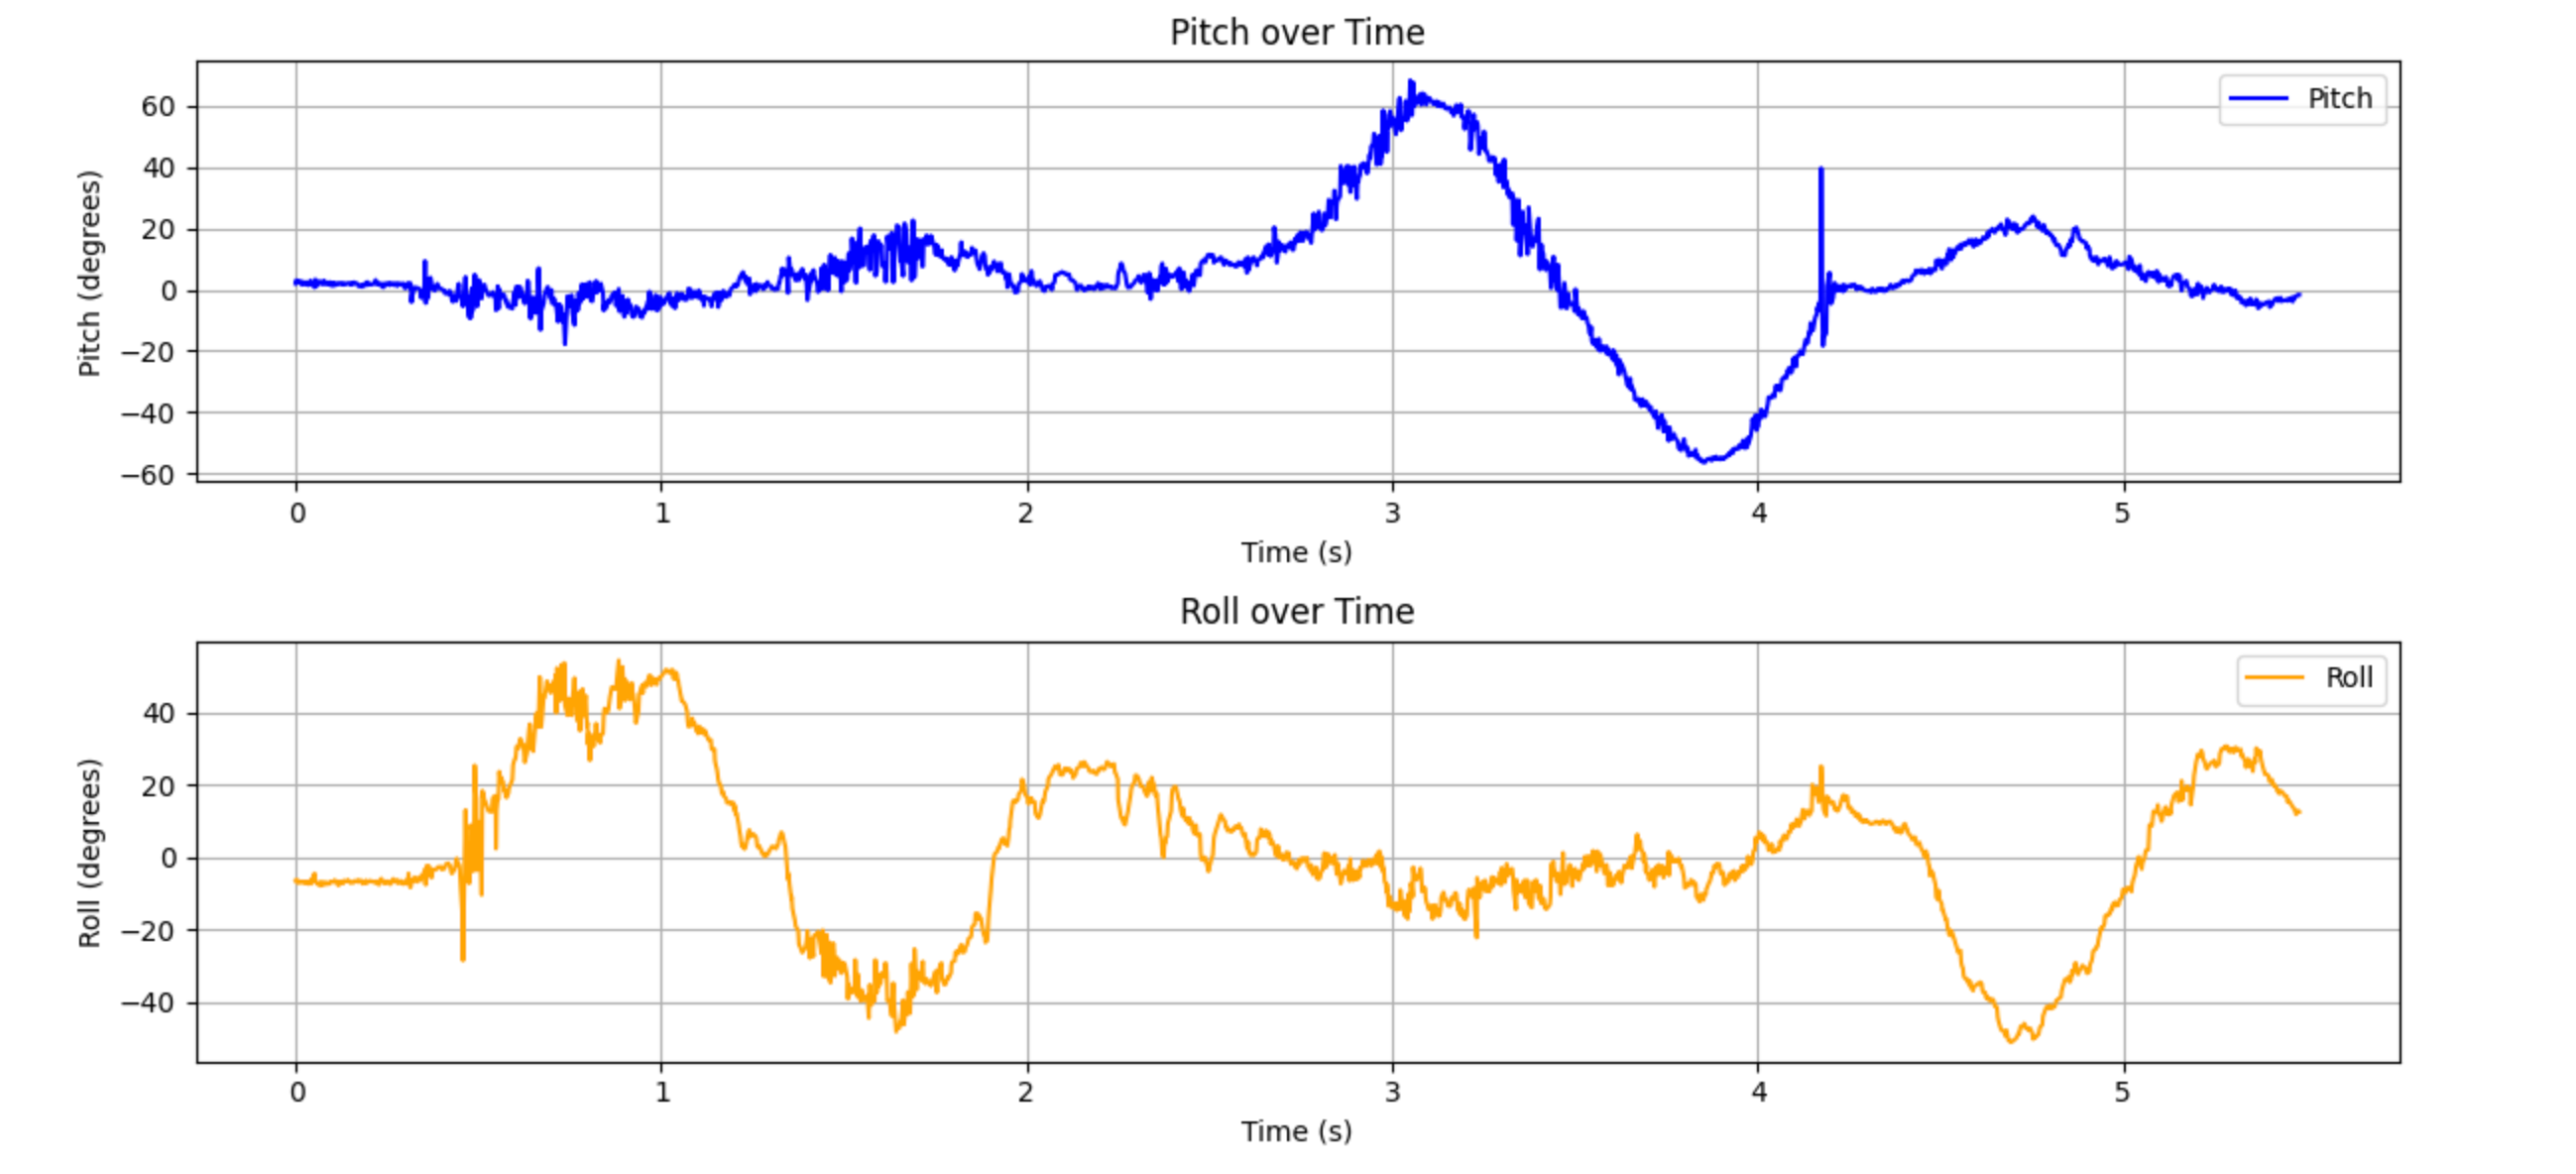
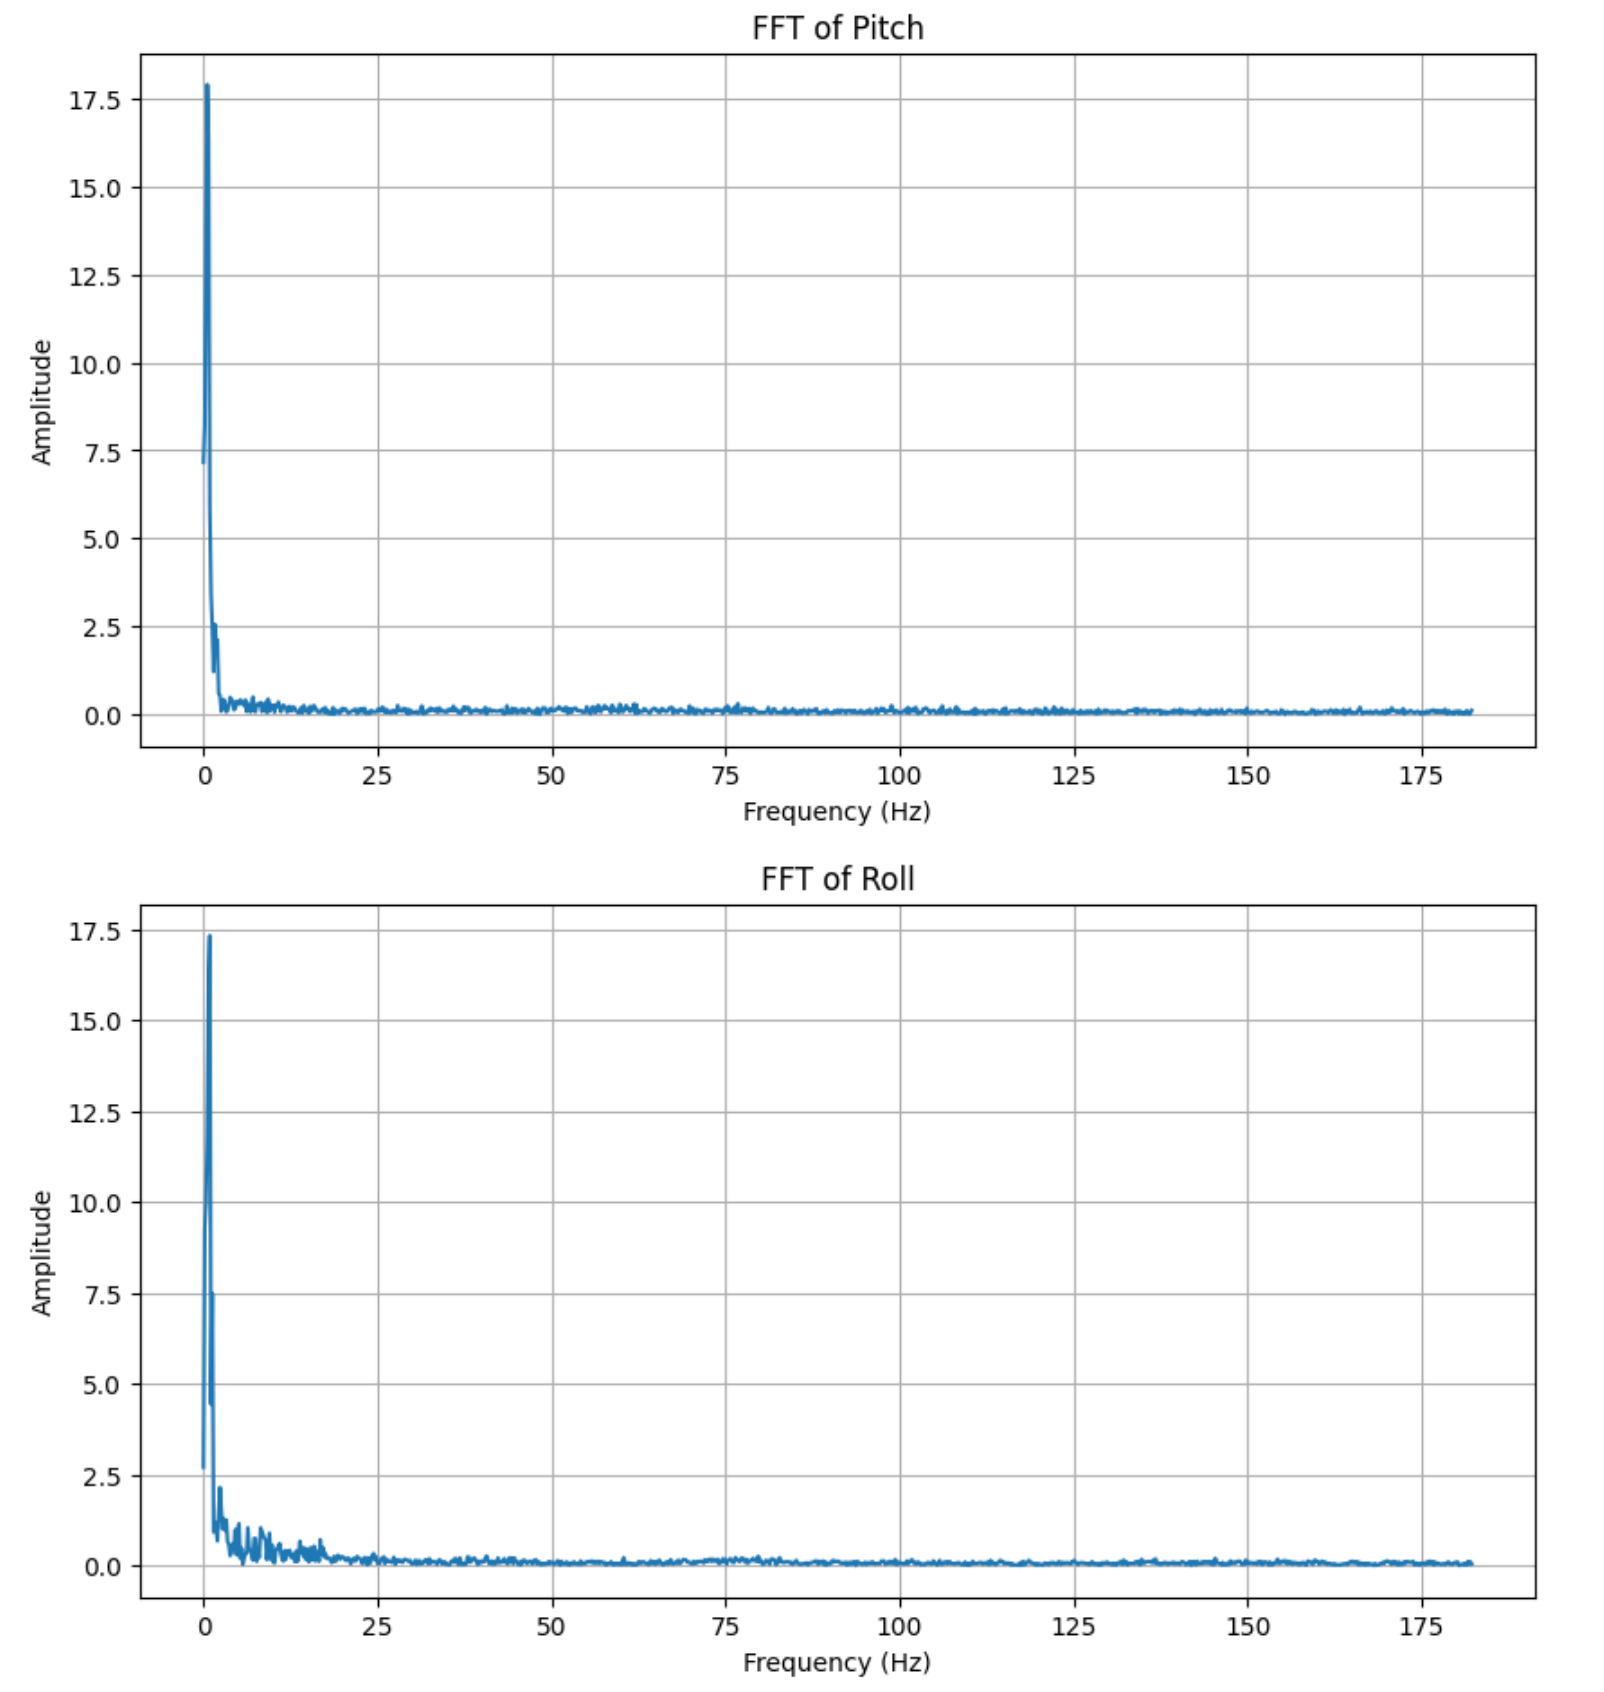
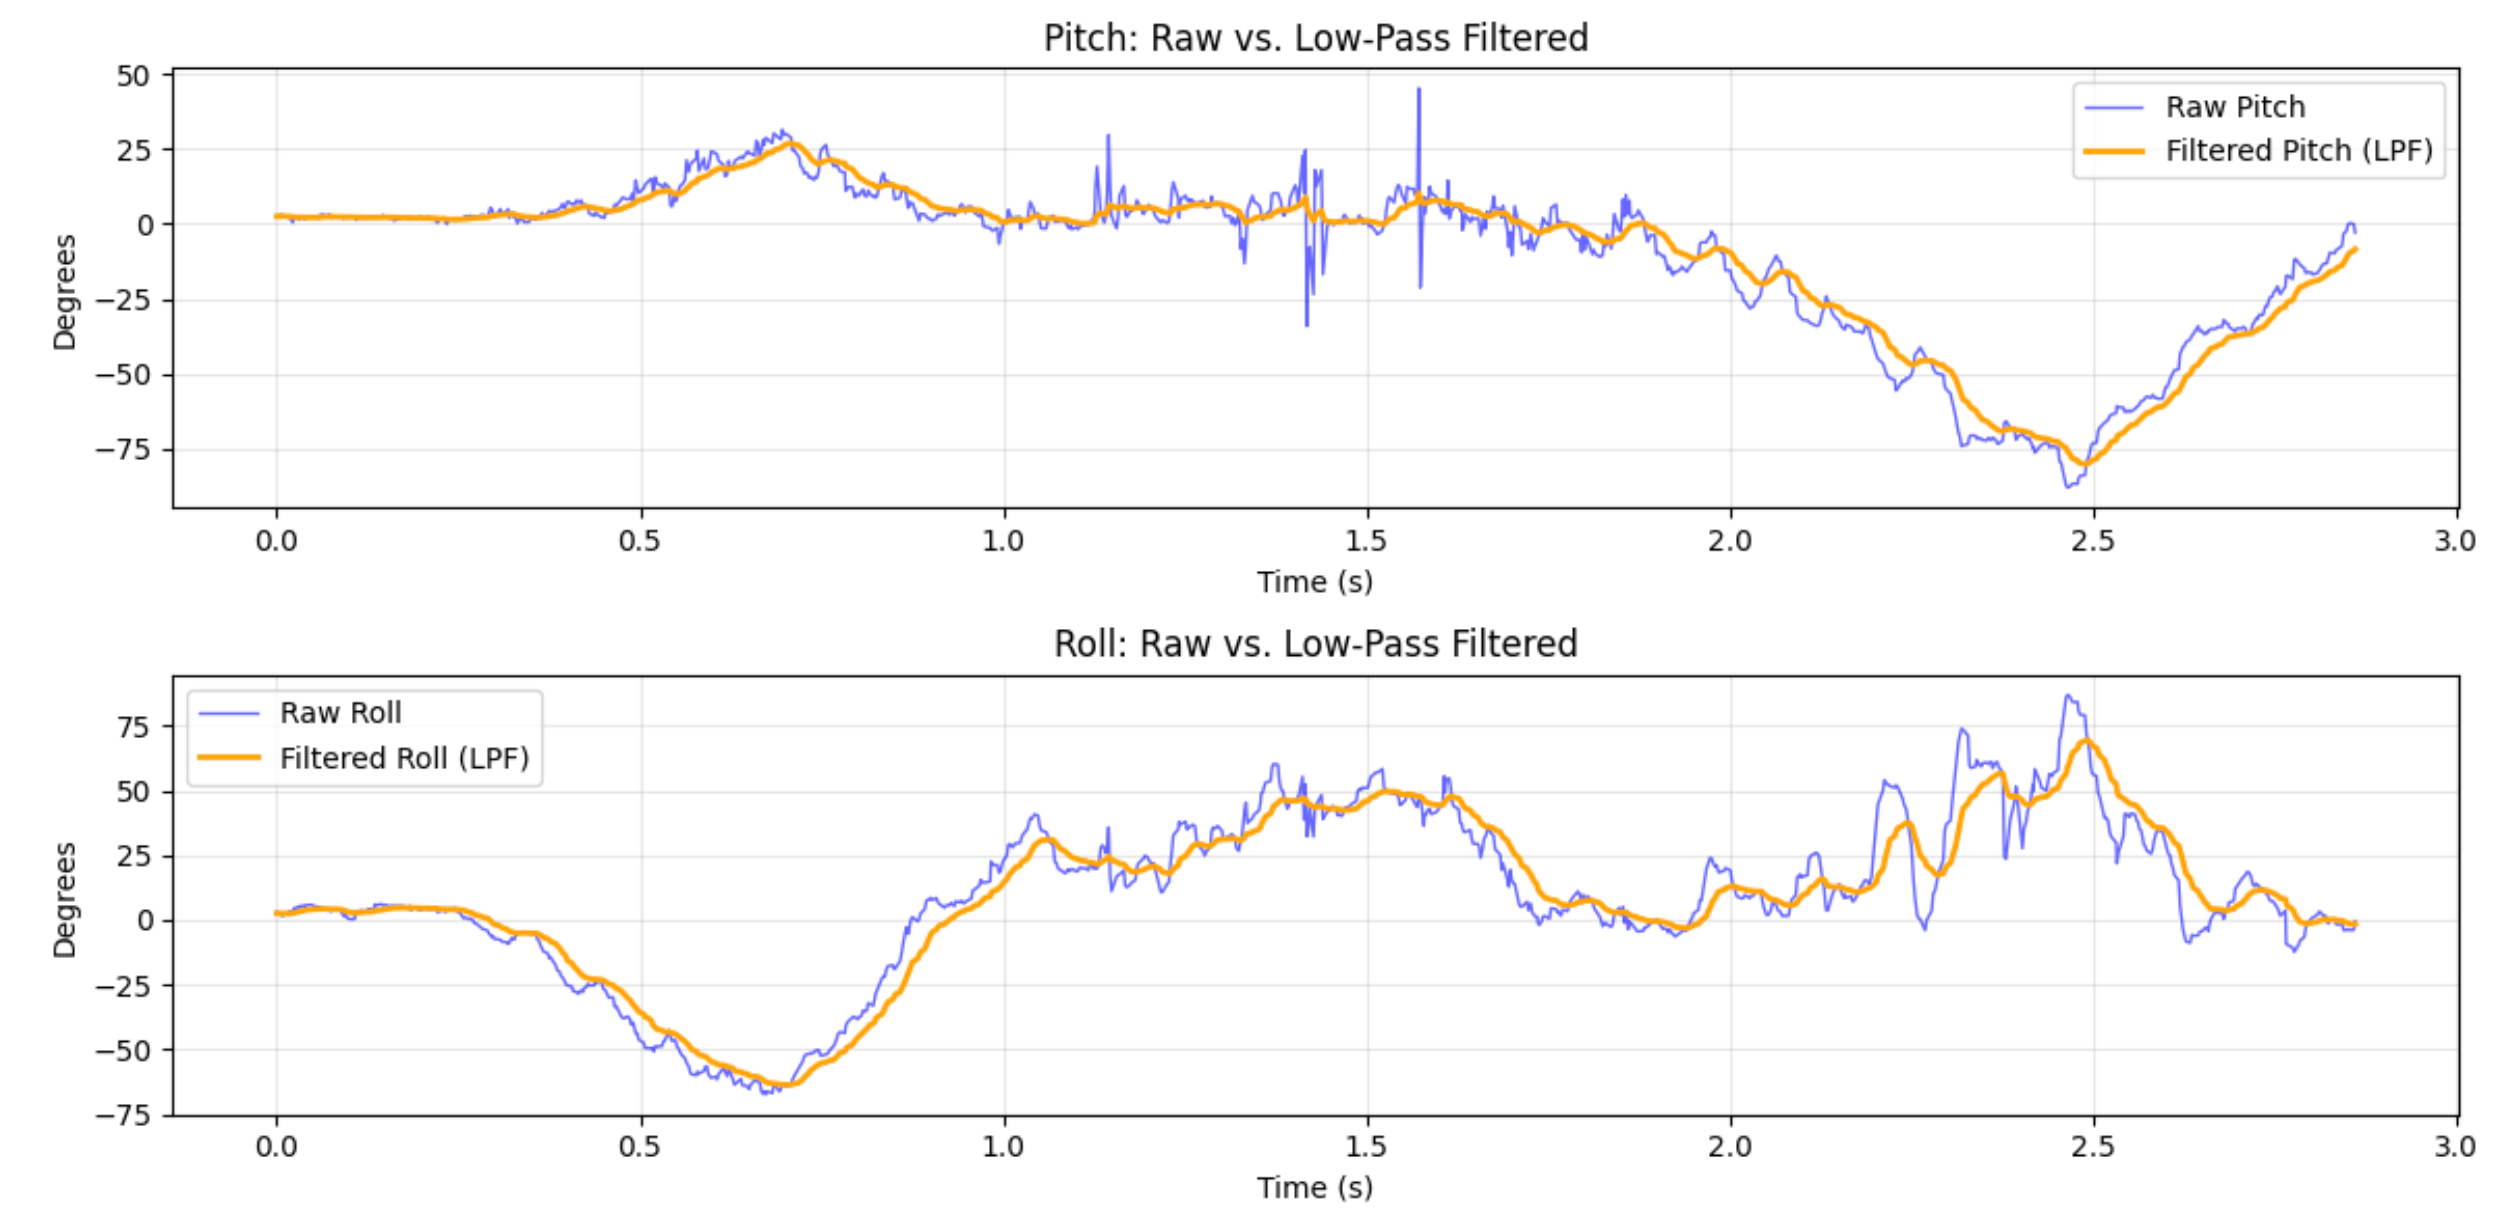
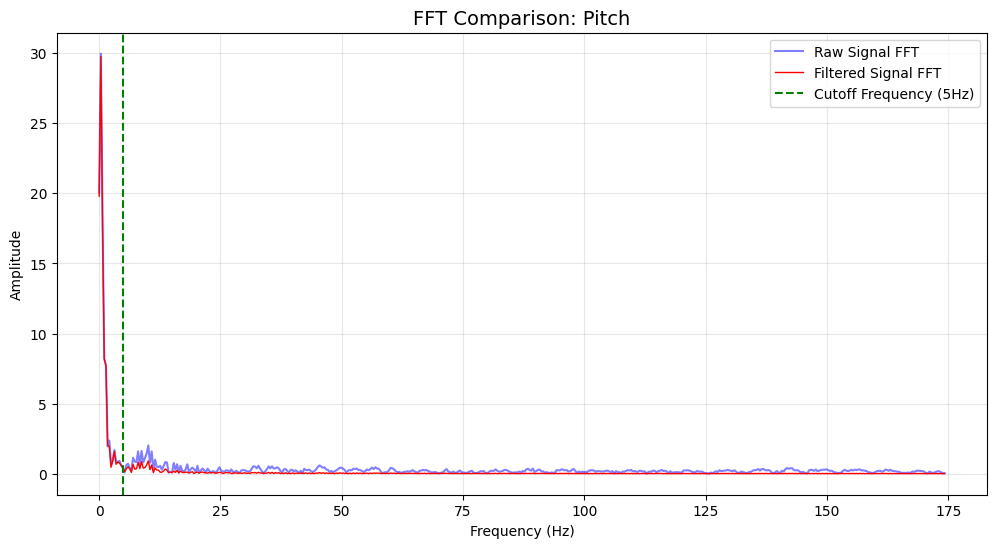
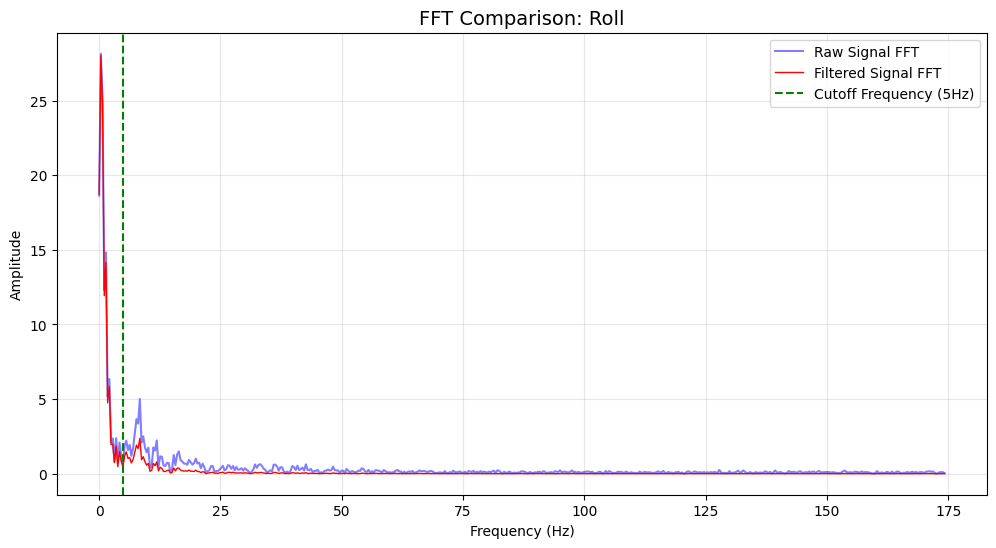
To analyze noise in the signal, I processed it using a Fourier transform. I set the cutoff to 5Hz and calculated $\alpha$ as 0.0793 based on the sampling frequency. Subsequently, I resampled the accelerometer data. After applying low-pass filtering, the overall curve appeared smoother, eliminating the sharp peaks and troughs caused by low-frequency fluctuations in the original data. Upon re-examining the Fourier-transformed signal, we observed a significant reduction in amplitude below the cutoff frequency, confirming that this method effectively suppressed low-frequency components.
Gyroscope
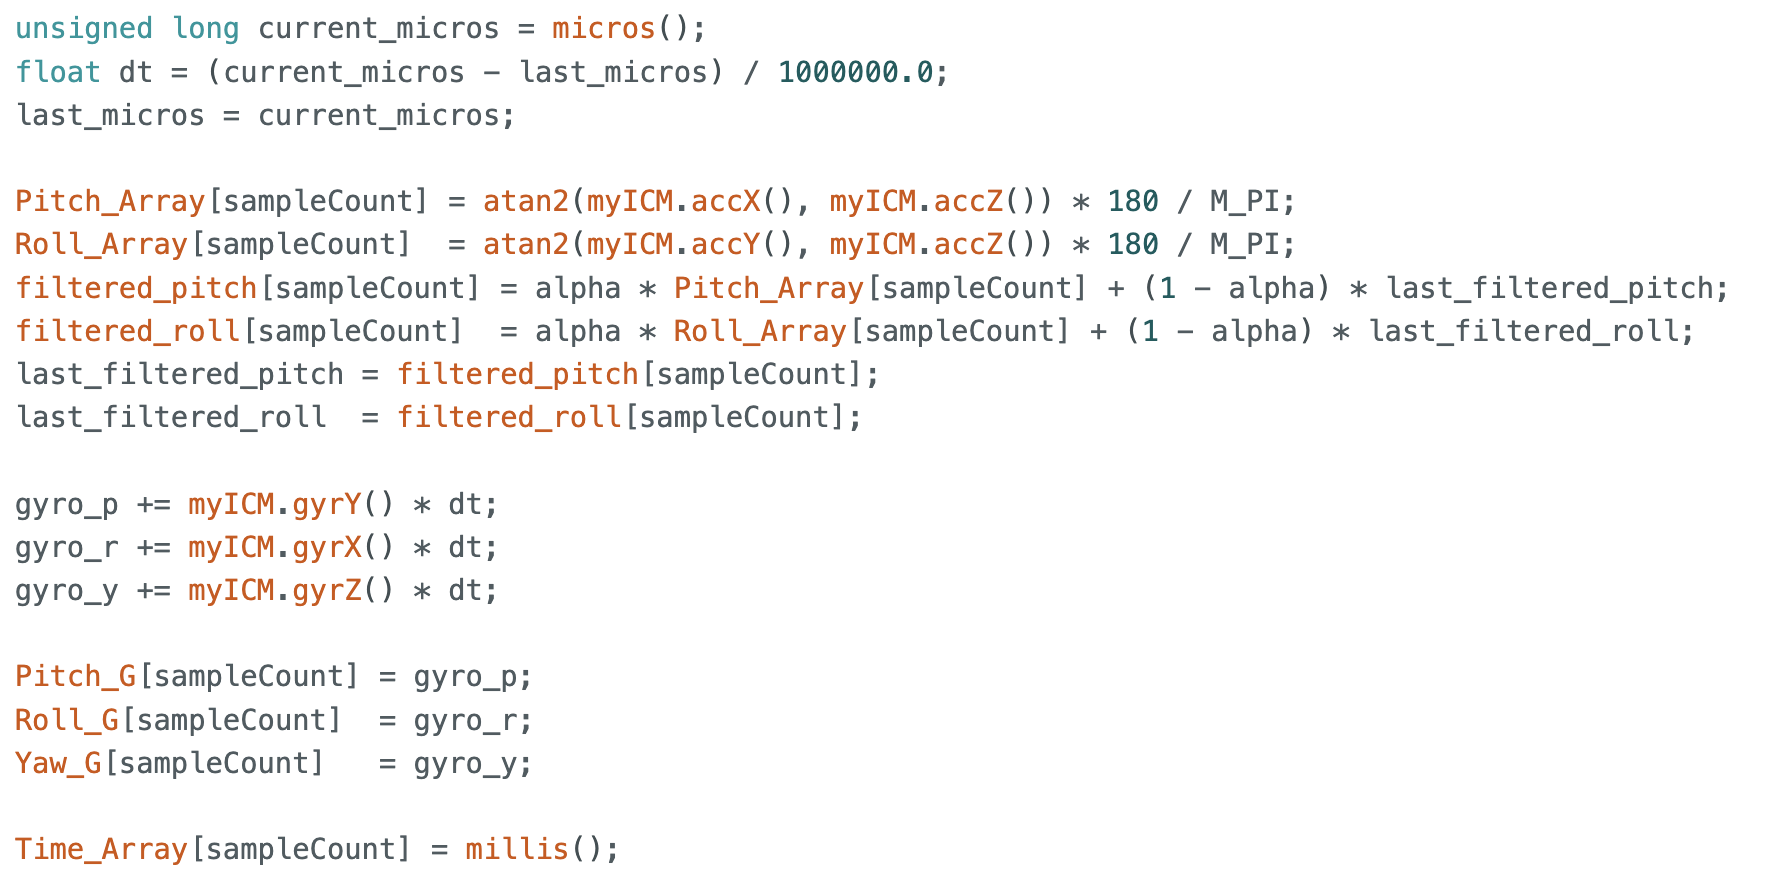
In this section, I implemented gyroscope-based calculations for pitch, roll, and yaw. This logic was integrated with the previous accelerometer setup to simultaneously record raw, low-pass filtered accelerometer data, and gyroscope data. The IMU was rotated manually to generate the data for the comparison plots.
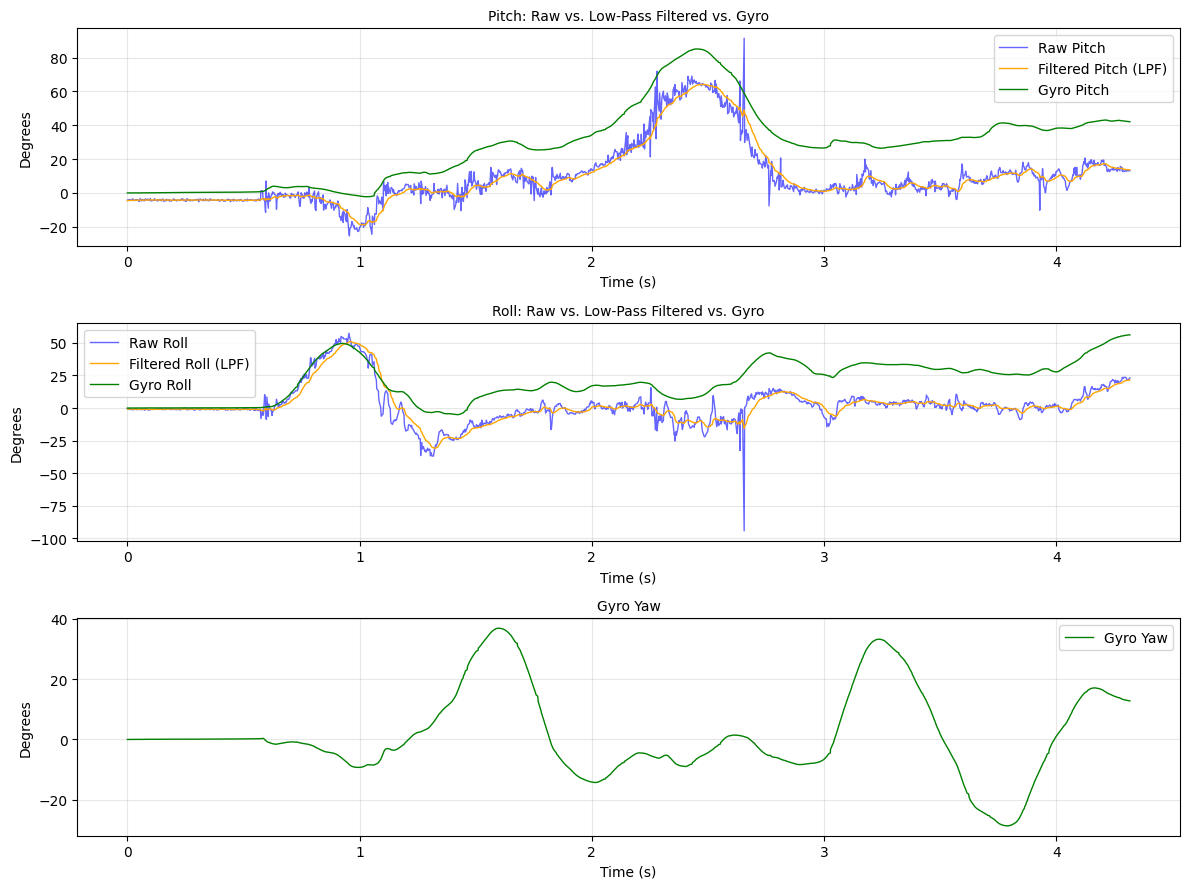
The most obvious difference in my plots is the drift of the gyroscope versus the noise of the accelerometer. We can notice that the Green line slowly separates from the Blue and Orange lines as time goes on. The plots demonstrate why sensor fusion is necessary. We need the Gyroscope for smooth, fast updates, but we also need the Accelerometer to constantly pull the Gyro back to reality and correct that drift.
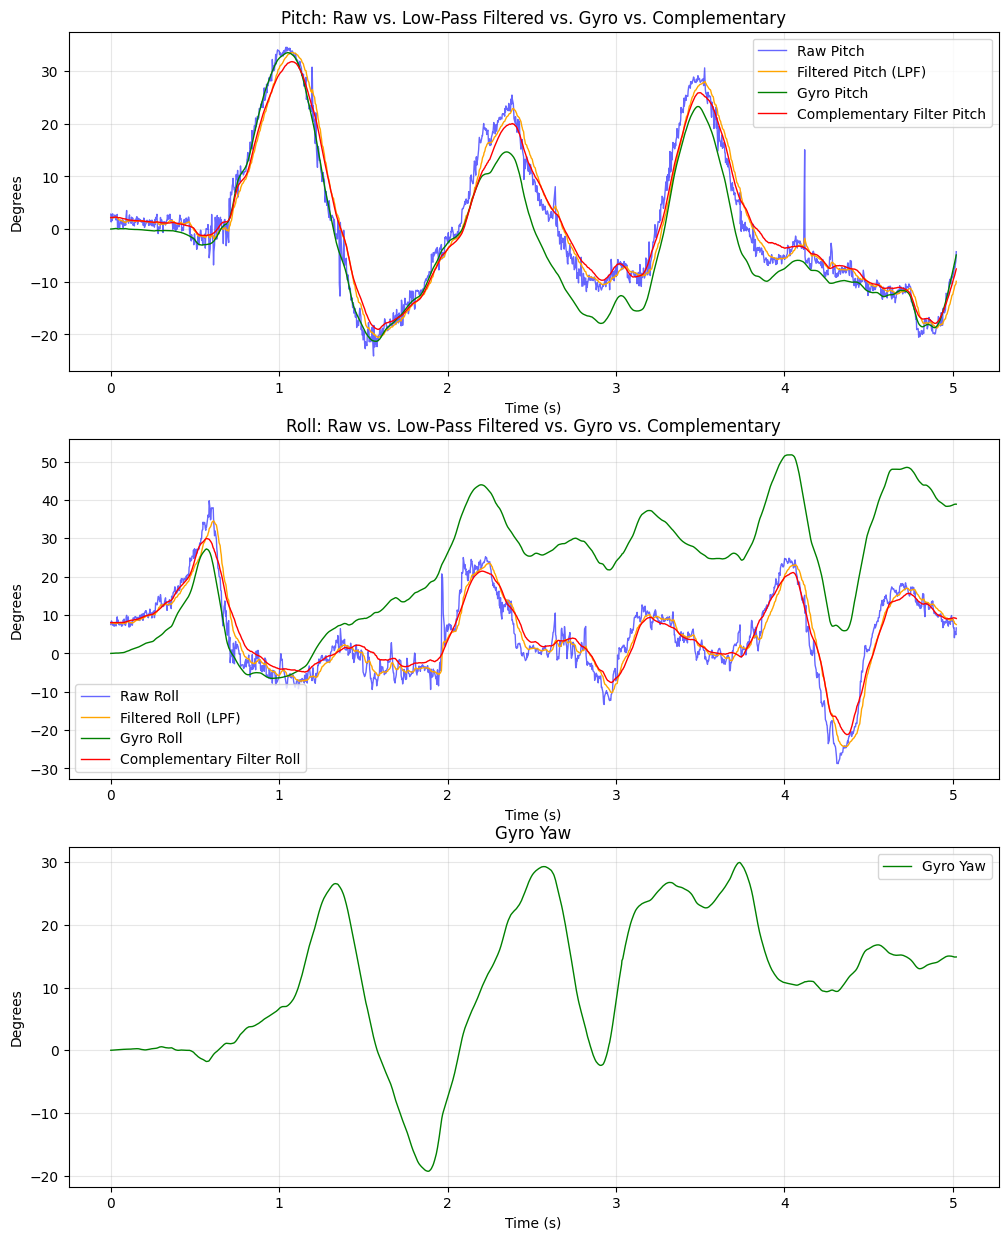
To address these limitations, a Complementary Filter was implemented with $\alpha_{com} = 0.04$. In code, I set another variable $\beta = 0.96$, which is equal to the complement of $\alpha_{com}$. This approach effectively combines the short-term stability of the gyroscope with the long-term accuracy of the accelerometer.

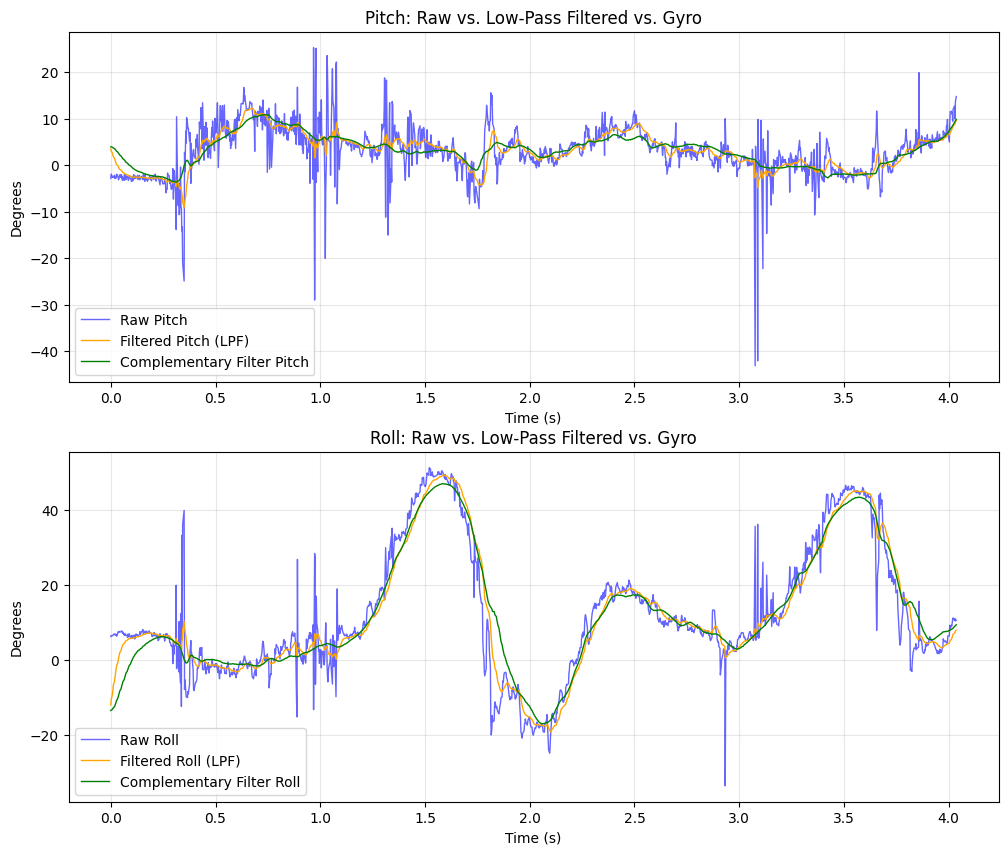
Finally, we can see that this specific method effectively eliminates the long-term drift observed in the raw gyroscope data while rejecting the high-frequency jitter present in the accelerometer readings.
Sample Data
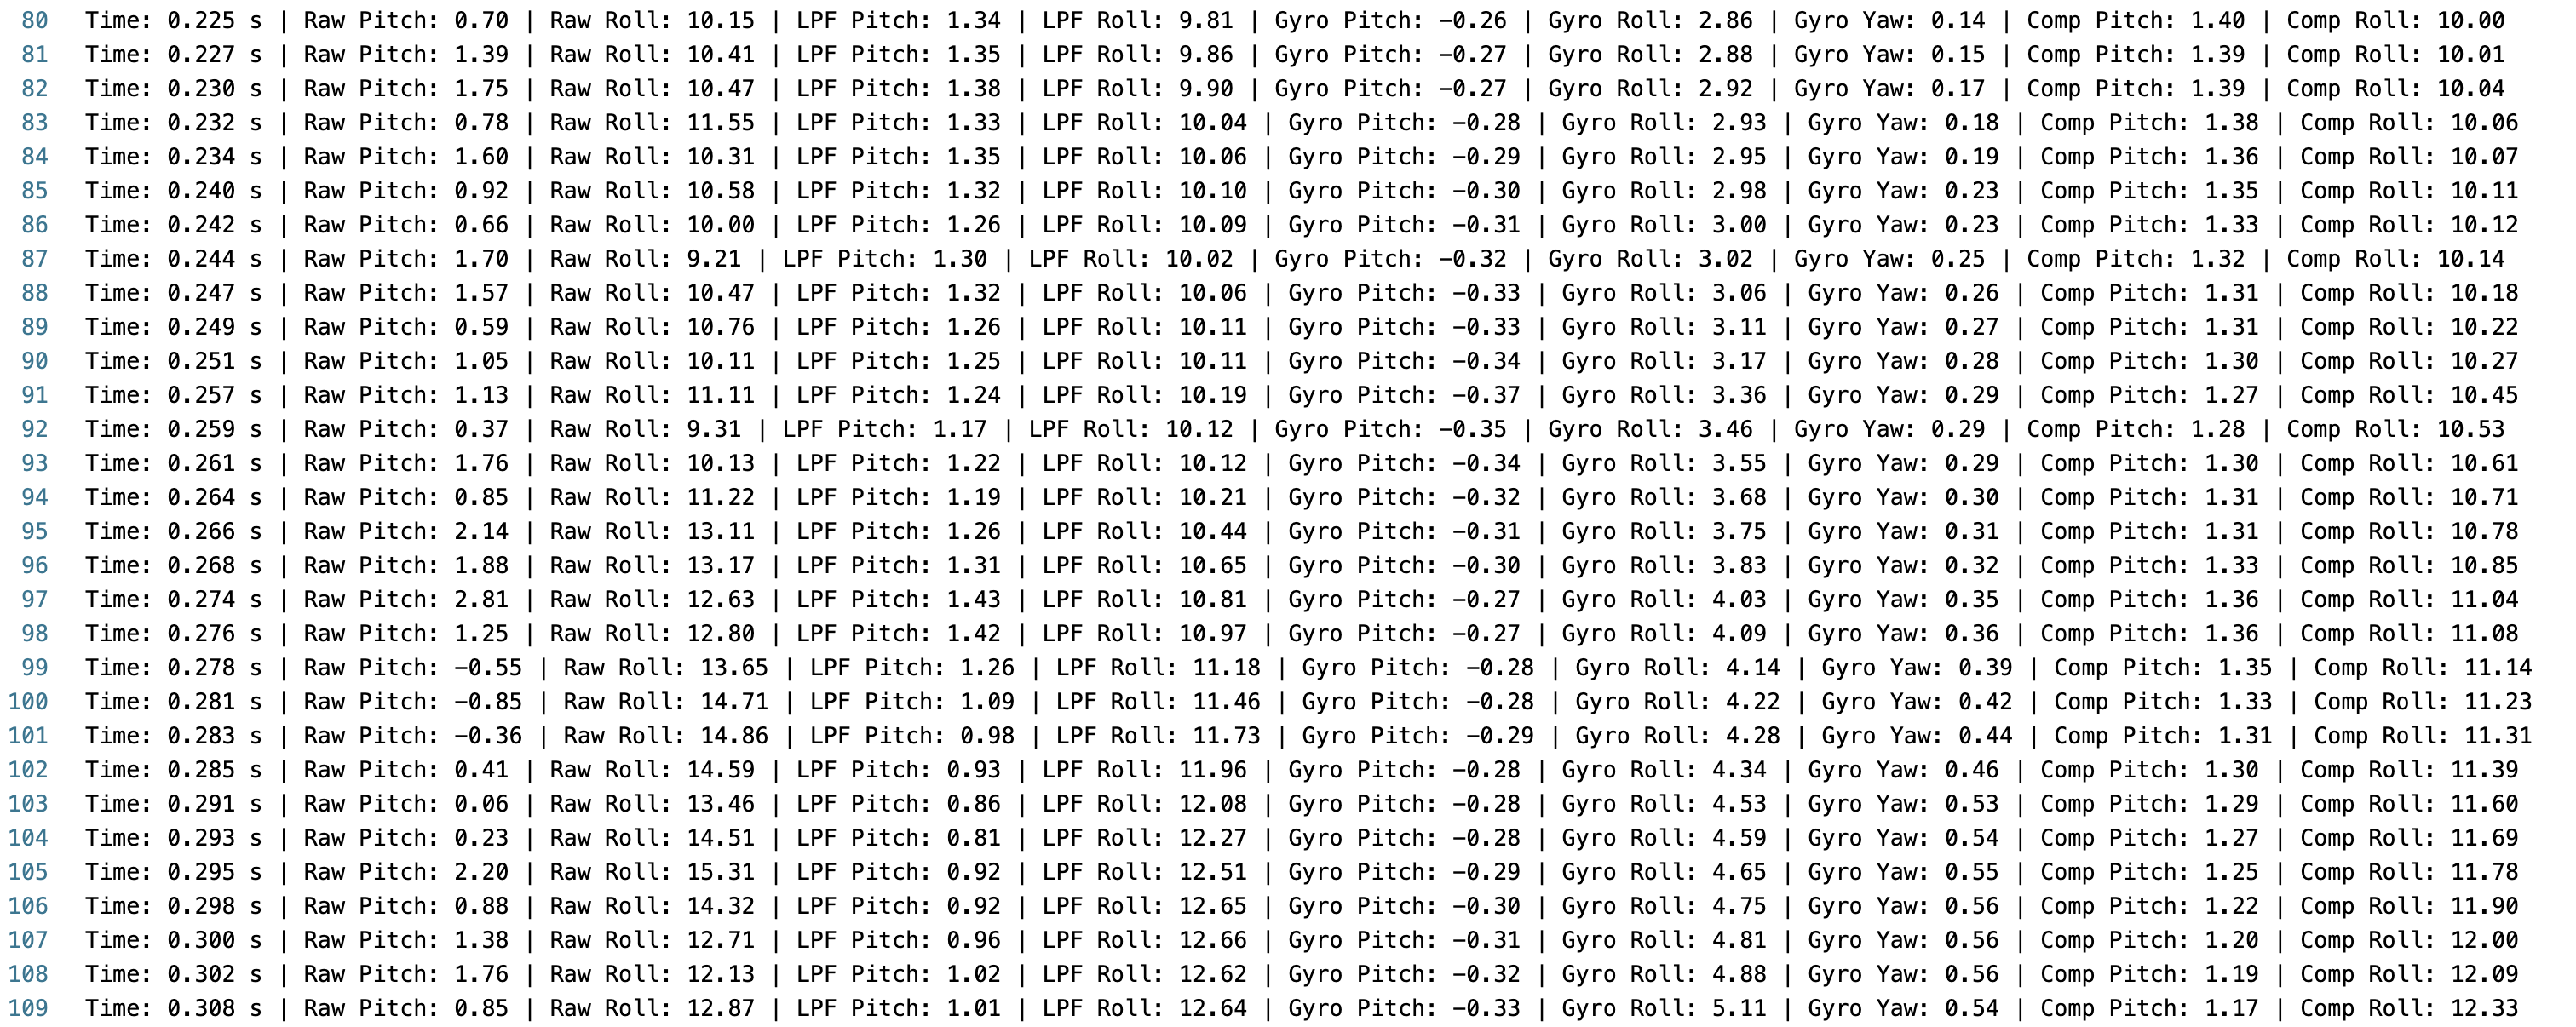
To achieve high-speed data collection, I implemented a sampling loop controlled by a start_flag. Upon receiving the GET_IMU_START command from Python, the flag is set to true, triggering the recording process. The main loop exclusively handles IMU data retrieval and storage into pre-allocated arrays, with all print statements removed to minimize latency. For every iteration, I captured 10 distinct data points: Timestamp, Accelerometer: Pitch and Roll (Raw), Low-Pass Filter (LPF): Pitch and Roll, Gyroscope: Pitch, Roll, and Yaw , Complementary Filter: Pitch and Roll.
After 5 seconds, the GET_IMU_STOP command terminated data collection and initiated Bluetooth transmission. A total of 1,726 entries were captured, corresponding to an effective sampling rate of approximately 343 Hz.
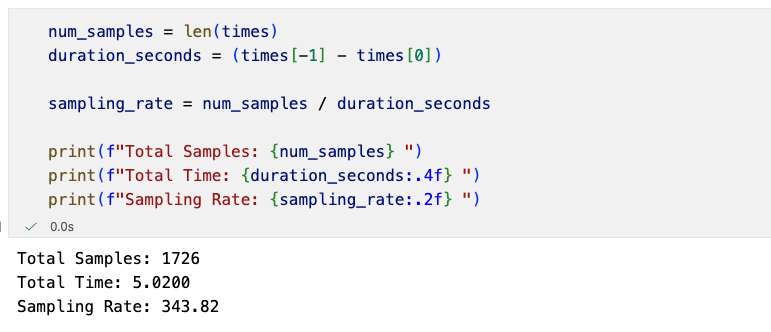
This demonstrates that the Artemis board is capable of efficiently capturing and storing dense, time-synchronized IMU data well beyond the requirements of this lab.
Record a Stunt
I played with the remote-controlled car for a while and found it incredibly fast. Plus, pressing the left and right buttons makes it spin in place, which is really fun.
Reference
Thanks to Professor Helbling and the TAs for their help during lab sessions. I refer to Katherine Hsu's website as guidance and as a reference for web design. I used Nano Banana Pro to help me with generating the cover of my lab, which is shown in the home page.
Note
In the report, I did not put some code implementations of simple functions and roughly duplicate parts. If necessary, please feel free to contact me.